Machine Learning · Distributed Systems · FinTech

Aegis: A Cost-Aware
Real-Time Fraud
Intelligence System

An end-to-end fraud detection pipeline built on PySpark and Databricks, integrating streaming ingestion, supervised classification under severe class imbalance, cost-aware decisioning, and statistical drift monitoring.

Kashish Lalwani  ·  Stony Brook University  ·  Built entirely on free-tier Databricks Community Edition

View on GitHub Read the Write-up

Why This Problem Is Hard

Fraud detection in production is a systems engineering challenge, not just a classification challenge. Most academic work stops at offline metrics. Aegis was built to close that gap.

Streaming, Not Batch

Transactions arrive continuously. The pipeline must ingest, enrich, and score each one in real time using Spark Structured Streaming, not nightly batch jobs.

Asymmetric Error Costs

A missed fraud costs ~$1,500,000. A false alarm costs $15. The default 0.5 threshold treats both errors as equal. It does not. The system replaces it with a cost-justified three-tier policy.

Severe Class Imbalance

Only 0.138% of transactions are fraudulent. A naive model predicting "no fraud" everywhere would score 99.86% accuracy and catch zero frauds. Class-weighted training is essential.

Distribution Drift

Fraudster behavior shifts over time. A model trained today may degrade silently. Aegis includes a dual-signal PSI + KS drift layer validated through a controlled 3x injection experiment.


Results at a Glance

Evaluated on PaySim (synthetic): 49,962 transactions, 0.138% fraud rate, all compute on free-tier Databricks Community Edition. Assumed costs: missed fraud $1.5M, false alarm $15. Synthetic data, so results are an upper bound.

0.994
Weighted F1 on held-out test set (100-tree Random Forest)
0.993
AUC: Area under the ROC curve
13
Fraud cases in the held-out test set (69 across all 49,962 transactions)
0.23%
False-positive rate on legitimate transactions (all transactions, incl. training data)
0.640
PSI after 3x drift injection (baseline: 0.003)
23x
Reduction in false-alarm queue vs. cost-theoretic minimum
$19.5M
Cost gap quantified by 19-point threshold sweep
-0.0059
Largest F1 drop in feature ablation (balance_diff removed)

Six-Phase Pipeline

Each phase consumes the verified output of the previous phase as a Delta Lake table, mirroring production pipeline design patterns.

1
Data Engineering

Data Cleaning and Validation

Cleaned the raw PaySim dataset (50,500 to 49,962 rows). Removed simulator artifacts: column-shift label corruption and malformed amount values, using Spark's try_cast operator. Verified all 11 columns null-free before persisting to Delta Lake.

2
Streaming

Spark Structured Streaming and Feature Engineering

Wrapped the cleaned Delta table in a Spark Structured Streaming pipeline with maxFilesPerTrigger=1 to simulate live transaction arrival. Engineered two domain features inline: is_high_risk_type (TRANSFER/CASH_OUT binary flag) and balance_diff (sender account drainage signal). Completed in 17.5 seconds across 49,963 rows.

3
Machine Learning

Class-Weighted Random Forest Classifier

Trained a 100-tree Random Forest on 7 features. Class weights of 356.45 (fraud) and 0.50 (non-fraud) computed analytically to address the 0.138% imbalance. 80/20 train-test split (39,922 / 10,040 rows). Achieved weighted F1 = 0.994, AUC = 0.993 on the held-out set (13 fraud cases). Feature ablation confirms balance_diff as the most informative single feature.

4
Decision Layer

Cost-Aware APPROVE / FLAG / BLOCK Policy

Replaced the default 0.5 cutoff with a three-tier policy anchored in a cost matrix: $1,500,000 per missed fraud vs. $15 per false alarm (a 100,000x asymmetry). Thresholds: APPROVE below 0.30, BLOCK above 0.70, FLAG in between for manual review. Across all 49,962 transactions (training data included), it catches 67 of 69 fraud cases at a 0.23% false-positive rate.

5
Monitoring

PSI and KS Drift Monitoring

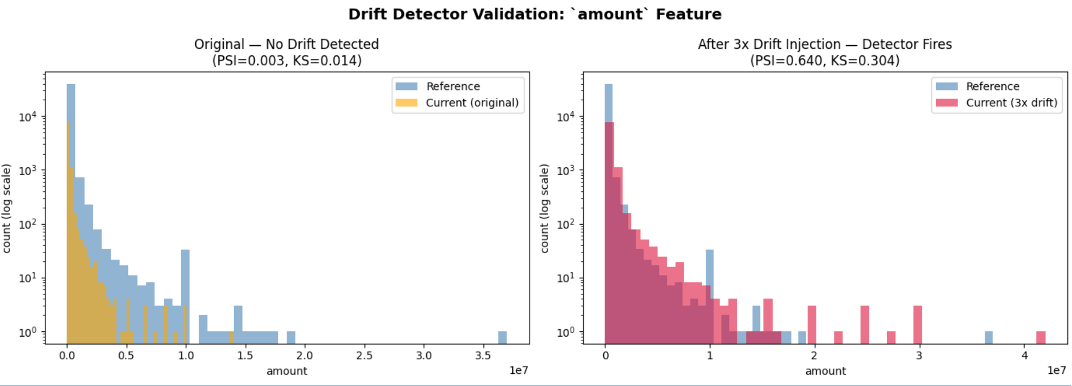
Applied Population Stability Index and Kolmogorov-Smirnov tests to all 7 model features on a temporal reference/current split. Validated via 3x amount injection: PSI rose from 0.003 to 0.640 (~190x increase), KS statistic from 0.014 to 0.304 (~22x increase), p-value collapsed to numerical zero. Detector fires on real drift and stays silent on stable data.

6
Optimization

19-Point Threshold Cost Sweep

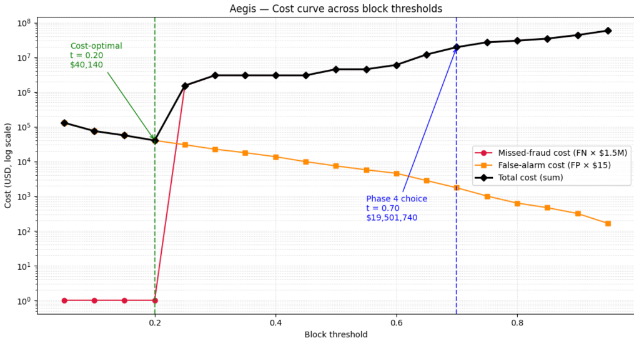
Swept thresholds from t = 0.05 to t = 0.95 in the cost space. Cost-theoretic minimum at t = 0.20 ($40,140 total cost, 2,676 false alarms). The operational t = 0.70 choice pays a $19.5M modeled premium to reduce the false-alarm queue 23x, justified by customer trust, queue capacity constraints, and regulatory exposure.


Results and Figures

All figures generated from original Databricks notebooks. Click any image to view full size.
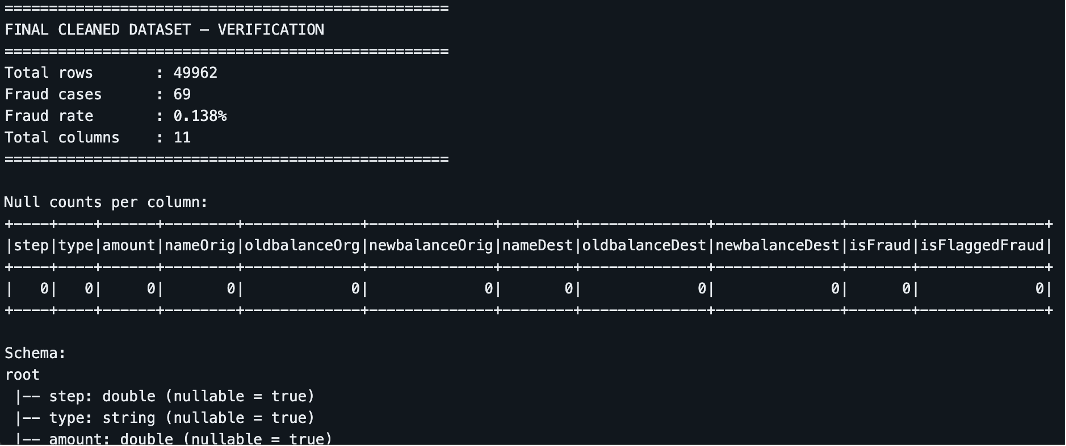
Cleaned dataset schema and null check
Phase 1 — Data Cleaning

Final cleaned schema and null verification after removing 538 corrupted rows. All 11 columns confirmed null-free, 49,962 rows retained.
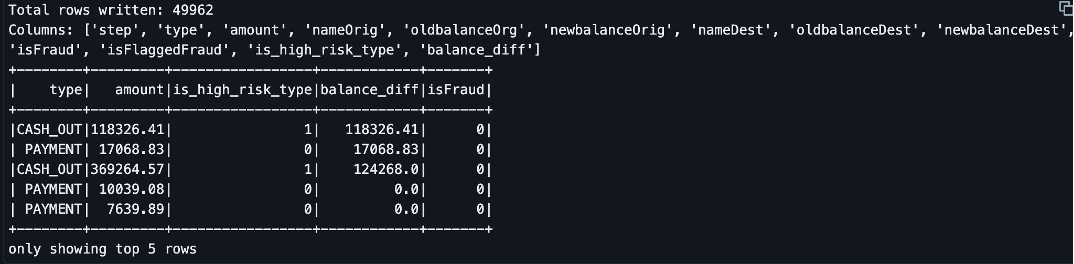
Streaming pipeline output sample
Phase 2 — Streaming Pipeline

Sample output from the Spark Structured Streaming job with the two engineered feature columns: is_high_risk_type and balance_diff.
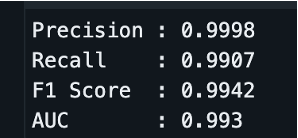
Model Precision/Recall/F1/AUC
Phase 3 — Model Performance

Precision, recall, weighted F1 = 0.994, and AUC = 0.993 on the 10,040-row held-out test set containing 13 fraud cases.
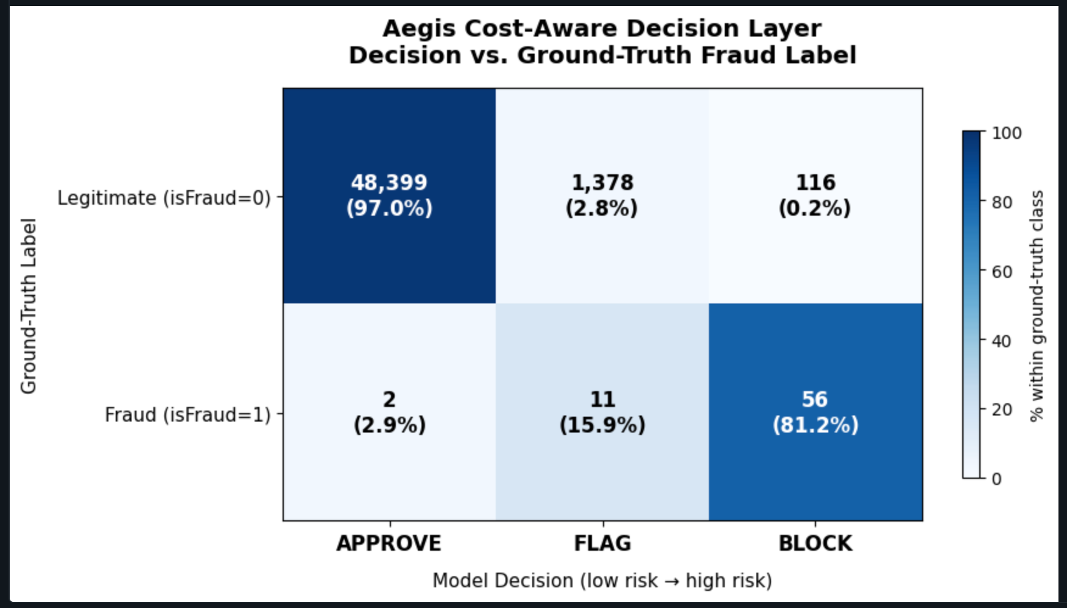
Cost-aware decision heatmap
Phase 4 — Decision Heatmap

Cross-tabulation of APPROVE / FLAG / BLOCK decisions against ground-truth labels across all transactions, training data included: 67 of 69 frauds caught; 116 legitimate transactions blocked (0.23%).
Drift detector validation chart
Phase 5 — Drift Validation

PSI and KS statistics before and after 3x amount injection. PSI rises from 0.003 to 0.640, confirming the detector is both specific (silent on stable data) and sensitive (fires on real drift).
19-point threshold sweep cost curve
Phase 6 — Cost Curve

19-point threshold sweep from t = 0.05 to t = 0.95. The operational t = 0.70 pays a $19.5M premium over the cost-theoretic optimum to achieve a 23x reduction in false alarms.


Key Takeaways

The engineering decisions that mattered most, and what this system demonstrates beyond the headline metrics.

The Threshold Is a Business Decision

The cost-theoretic optimum sits at t = 0.20. The operational choice of t = 0.70 pays a $19.5M modeled premium to reduce the false-alarm queue 23x. Neither is wrong. They answer different operational questions. Quantifying that gap in dollars is the engineer's job.

Behavioral Signals Beat Categorical Ones

Feature ablation shows balance_diff (account drainage) is the most informative feature, with an F1 drop of 0.0059 when removed — roughly 3x larger than removing the transaction-type flag. Fraud manifests through behavior, not just transaction category.

A Monitoring Layer Must Be Validated

A drift detector that only returns "no drift" on stable data is indistinguishable from a broken one. The 3x injection experiment confirms the layer is both specific (silent on stable data) and sensitive (PSI 0.003 to 0.640 under real drift).

Production ML Is a Systems Problem

Streaming ingestion, cost-aware decisioning, and drift monitoring are not add-ons to a classification model. They are the system. The model is one component. Without the other layers, a high F1 score does not translate to operational reliability.

Future Work

Three natural extensions that would increase production-relevance beyond the current implementation.

1
Scale

Online Learning for Production Scale

PaySim contains 49,962 transactions. A real payments processor handles millions per day. At that scale, periodic batch retraining of a Random Forest becomes a bottleneck. A streaming-friendly online classifier or a gradient-boosted alternative with incremental updates would be more appropriate and integrates directly into the existing Spark Streaming framework.

2
Features

Graph-Derived and Stateful Temporal Features

Single-transaction features cannot capture relational fraud patterns, for example one recipient receiving funds from multiple senders within a short window, or per-account 24-hour velocity spikes. Graph features and rolling stateful aggregations are the most impactful next additions and would integrate cleanly into the existing pipeline architecture.

3
Monitoring

Automated Threshold Recalibration on Drift

Currently the drift layer detects distributional shift and alerts, but the response is manual. A natural extension is automated threshold recalibration triggered by the drift signal, closing the feedback loop between monitoring and decisioning without requiring human intervention on every shift event.


Technical Stack

Built entirely on free, open-source tools. No paid infrastructure. No proprietary data.

Apache Spark / PySpark
Distributed data processing and ML training
Spark Structured Streaming
Real-time micro-batch transaction ingestion
Delta Lake
ACID-compliant pipeline state persistence
Spark MLlib
Distributed Random Forest with class weighting
Databricks Community Edition
Free-tier managed Spark environment
SciPy
Kolmogorov-Smirnov two-sample drift test
PSI (Population Stability Index)
Banking-standard distributional drift metric
Matplotlib
Cost curves, heatmaps, drift charts
PaySim Dataset
Synthetic mobile money transactions (open data)

About

Built to demonstrate production-grade ML engineering on industry-standard tools.

Author

Kashish Lalwani
MS Student, Stony Brook University

LinkedIn →    GitHub →    Portfolio →

Project

Supervised by Professor Xiangmin (Jim) Jiao, Ph.D., Stony Brook University.

Full Write-up on Medium →

Source Code on GitHub →